Question 1 (a)

No, it is not reasonable to believe that the distribution of 40-yard
 running times is approximately normal, because the minimum time is
 only 1.33 standard deviations below the mean 4.4—4.6 —1.33 . In a
 normal distribution, approximately of the z-scores are below 0.15
 —1.33. However there are no running times less than 4.4 seconds,
 which indicates that there are no running times with a z-score less
 than —1.33. Therefore, the distribution of 40-yard running times is
 not approximately normal.

Question 1 (b)

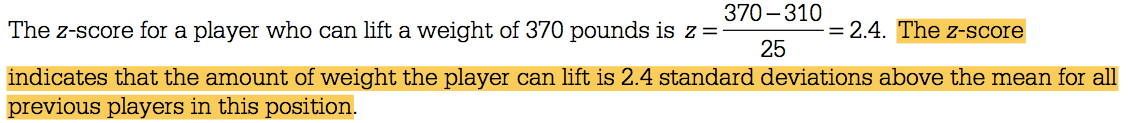
  • How to interpret the z-score

    370-310 The z-score for a player who can lift a weight of 370 pounds
is z = 25 Indicates that the amount o weight the player canlift IS 2.4
standard deviations above the meanforall previous players in this
position.

Question 2 (b)

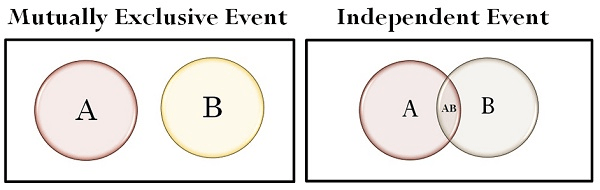
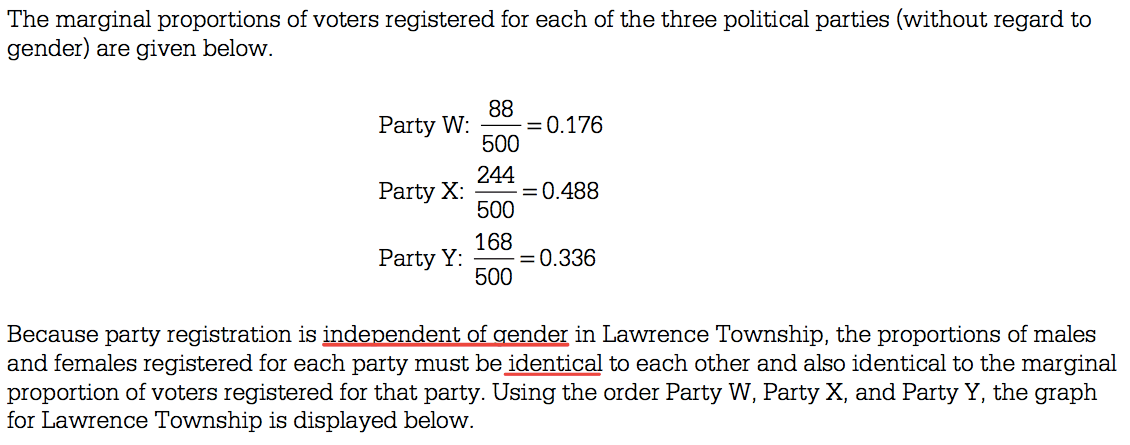
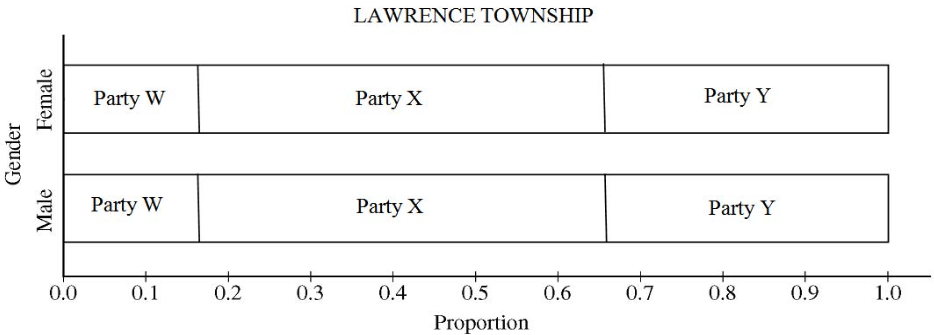
  • Independence vs. Dependence

    • A conditional probability is the probability of some event occurring, given that some other event has already occurred. The conditional probability of event X occurring, given that some other event Y has already occurred, is written as P(X|Y).

    • For example, P(M|N) would be the probability of the occurrence of event M given that event N has already occurred. It would be read as “the probability of M, given N.”

    • As stated earlier, two events are considered independent if the occurrence of one of the events does not change the probability of the other event from what it would have been had the first event not occurred. Thus, two events, X and Y, are independent if P(X|Y) = P(X) or P(Y|X) = P(Y)

    • Actually, these two conditional relationships are related. If one is true, the other must be true. If one is false, the other must be false.

    • If P(X|Y) = P(X), then P(Y|X) = P(Y), and the events are independent.

    • If P(X|Y) ≠ P(X), then P(Y|X) ≠ P(Y), and the events are dependent.

    Mutually Exclusive Event Independent Event

Question 2 (c)

The marginal proportions of voters registered for each of the three
 political parties (without regard to gender) are given below. 88
 =0.176 Party W: 500 244 = 0.488 Party X: 500 168 = 0.336 Party Y: 500
 Because party registration is indeoendent of aender in Lawrence
 Township, the proportions of males and females registered for each
 party must be identical to each other and also identical to the
 marginal proportion of voters registered for that party. Using the
 order Party W, Party X, and Party Y, the graph for Lawrence Township
 is displayed below.

0.0 Party W Рапу W 0.1 0.2 0.3 I.AWRENCE TOWNSHIP Party Х Party Х
 0.4 0.5 0.6 Proportjon 0.7 Рапу У Party У 0.8 0.9 1.0

Question 3 (a)

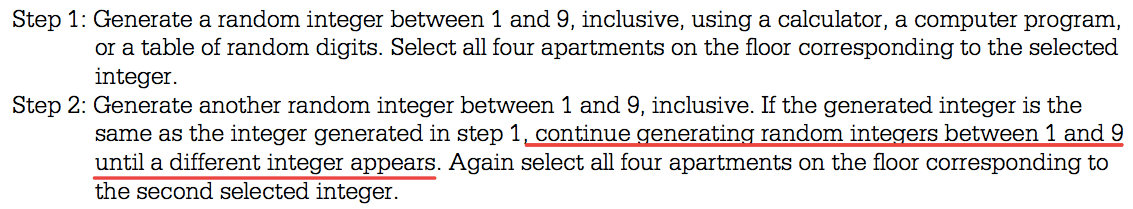
  • Process for randomly selecting 2 numbers from 1 to 9
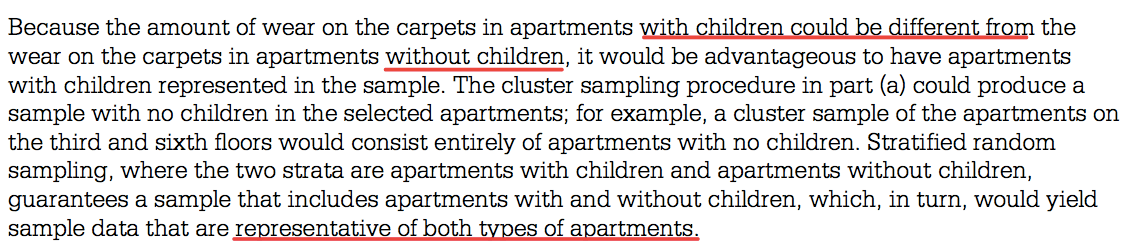
    Step 1: Generate a random integer between 1 and 9, inclusive, using
a calculator, a computer program, or a table of random digits. Select
all four apartments on the floor corresponding to the selected
integer. Step 2: Generate another random integer between 1 and 9,
inclusive. If the generated integer is the same as the integer
generated in step 1 , continue generatinq random inteqers between 1
and 9 until a different integer appears. Again select all four
apartments on the floor corresponding to the second selected integer.

Question 3 (b)

Because the amount of wear on the carpets in apartments
 with-GhiIdK.en-GQ.uld-he-diffeI.ent.ft.Q111 the wear on the carpets in
 apartments without children, it would be advantageous to have
 apartments with children represented in the sample. The cluster
 sampling procedure in part (a) could produce a sample with no children
 in the selected apartments; for example, a cluster sample of the
 apartments on the third and sixth floors would consist entirely of
 apartments with no children. Stratified random sampling, where the two
 strata are apartments with children and apartments without children,
 guarantees a sample that includes apartments with and without
 children, which, in turn, would yield sample data that are
 representative of both tvpes of apartments.

Question 4

  • Degrees of freedom for two-sample t-test.

    %-statistic — (4)2

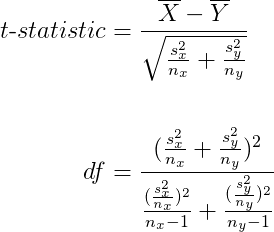
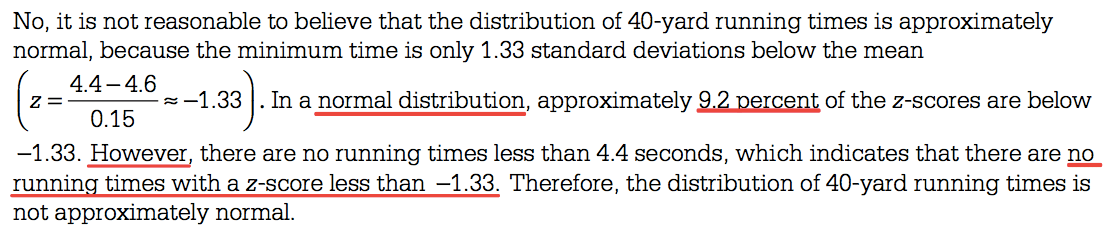
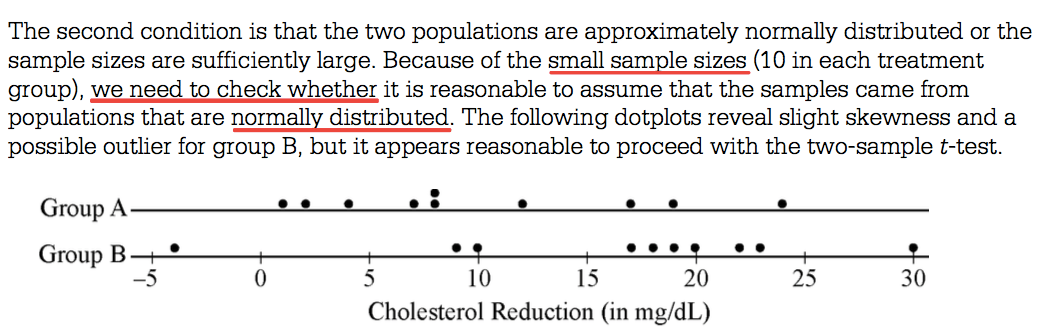
  • Graphs of both distributions must be produced and described to check the normality condition.
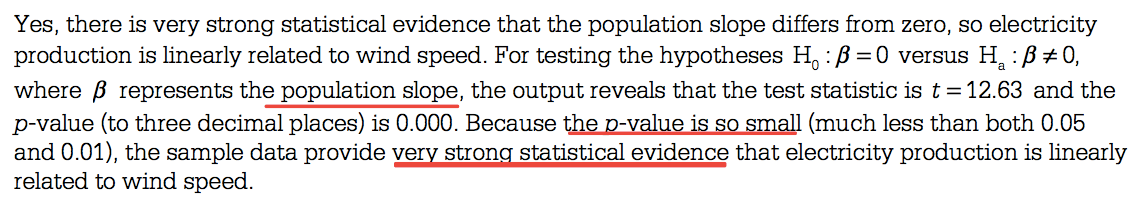
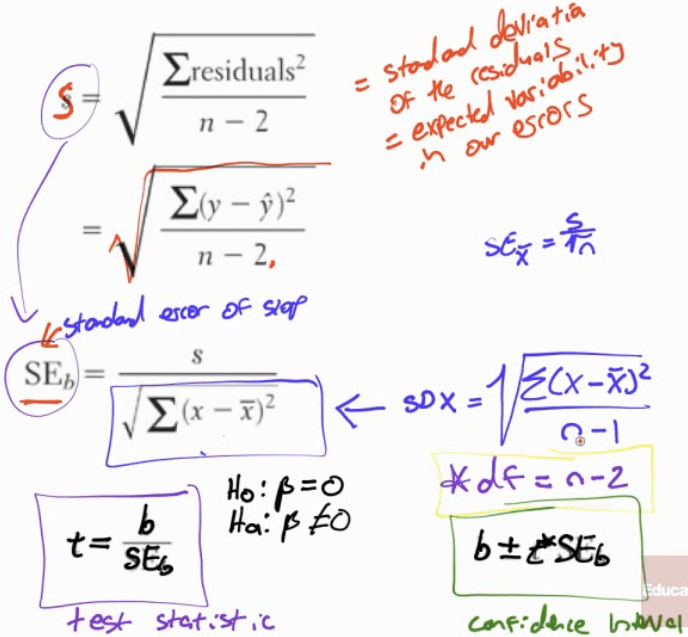
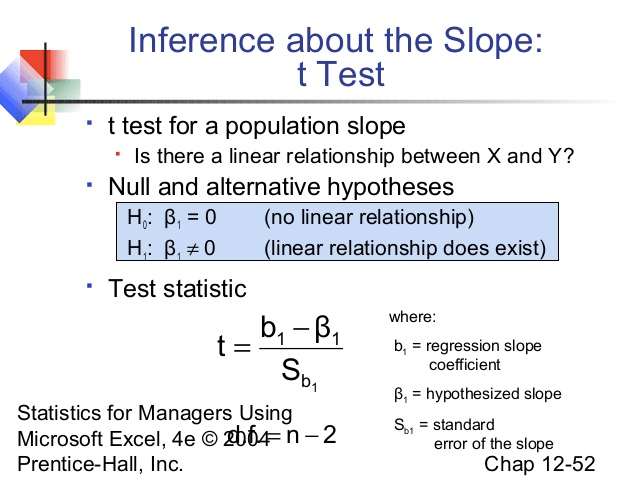
    The second condition is that the two populations are approximately
normally distributed or the sample sizes are sufficiently large.
Because of the small sample sizes (10 in each treatment group), we
need to check whether it is reasonable to assume that the samples came
from populations that are normally distributed. The following dotplots
reveal slight skewness and a possible outlier for group B, but it
appears reasonable to proceed with the two-sample t-test. Group A
Group B -5 5 10 15 20 25 30 Cholesterol Reduction (in mg/dL)

Question 5 (c)

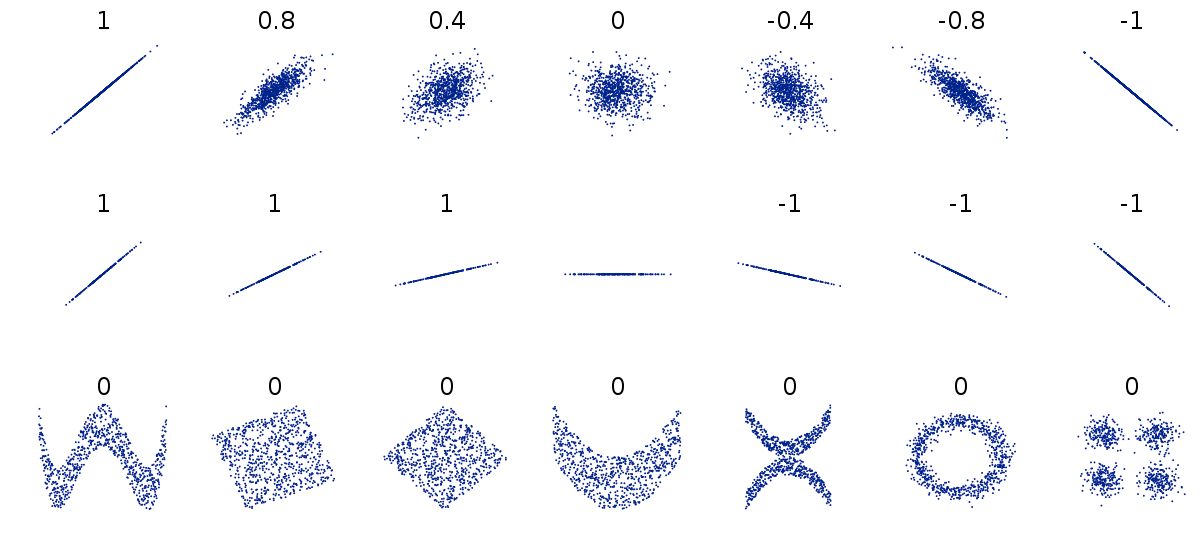
  • Correlation coefficient

    C:\\6432CA65\\FE01530B-89BD-4F8B-A3E1-55F12080AD12\_files\\image338.png

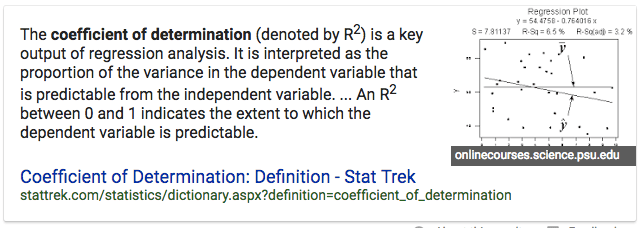
  • Coefficient of determination

    The coefficient of determination (denoted by R2) is a key output of
regression analysis. It is interpreted as the proportion of the
variance in the dependent variable that is predictable from the
independent variable. An R2 between O and 1 indicates the extent to
which the dependent variable is predictable. Coefficient of
Determination: Definition - Stat Trek Prot
onlinecourses.science.psu.edu
stattrek.com/statistics/dictionary.aspx?definition=coefficient\_of\_determination

Question 5 (d)

  • Explaining relationship

    Yes, there is very strong statistical evidence that the population
slope differs from zero, so electricity production is linearly related
to wind speed. For testing the hypotheses Ho : ß = 0 versus Ha : 0,
where represents the population slope, the output reveals that the
test statistic is t = 12.63 and the p-value (to three decimal places)
is 0.000. Because (much less than both 0.05 and 0.01), the sample data
provide that electricity production is linearly related to wind speed.

    n 2— n ,2— z»oegq-o «را ود - ن •ى (T) مى ى ؛ملا ه ت على ت 2-٥ لاتوج
هحاe،ع:مى

    Inference about the Slope: t Test t test for a population slope Is
there a linear relationship between X and Y? Null and alternative
hypotheses 131 = o (no linear relationship) linear relationshi does
exist Test statistic where: Statistics for Managers Using Microsoft
Excel, 4e O n -2 Prentice-Hall, Inc. b, = regression slope coefficient
= hypothesized slope So 1 = standard error of the slope Chap 12-52

Question 6 (a)

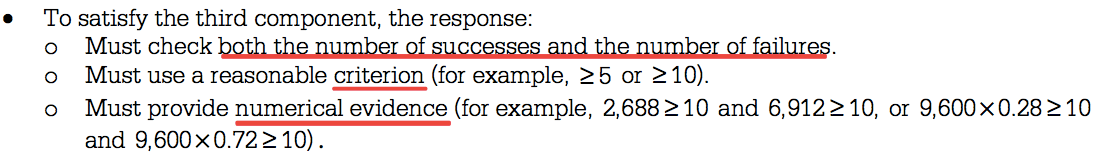
  • Checking condition for one-sample z-interval

    • Random

    • Normal: Large sample size

    To satisfy the third component, the response: o Must check o Must
use a reasonable criterion (for example, 5 or 210). o Must provide
numerical evidence (for example, 2,688 210 and 10, or 9,600x0.28210
and 10) .

results matching ""

    No results matching ""